Prometheus metrics
v3.6.0
dnspyre can be configured to export Prometheus metrics. This allows you to monitor the performance of dnspyre in real-time. This is controlled by --prometheus flag. The flag accepts a host:port address, where the metrics will be exposed on a HTTP server. Metrics are exposed on /metrics endpoint.
Following metrics are exposed:
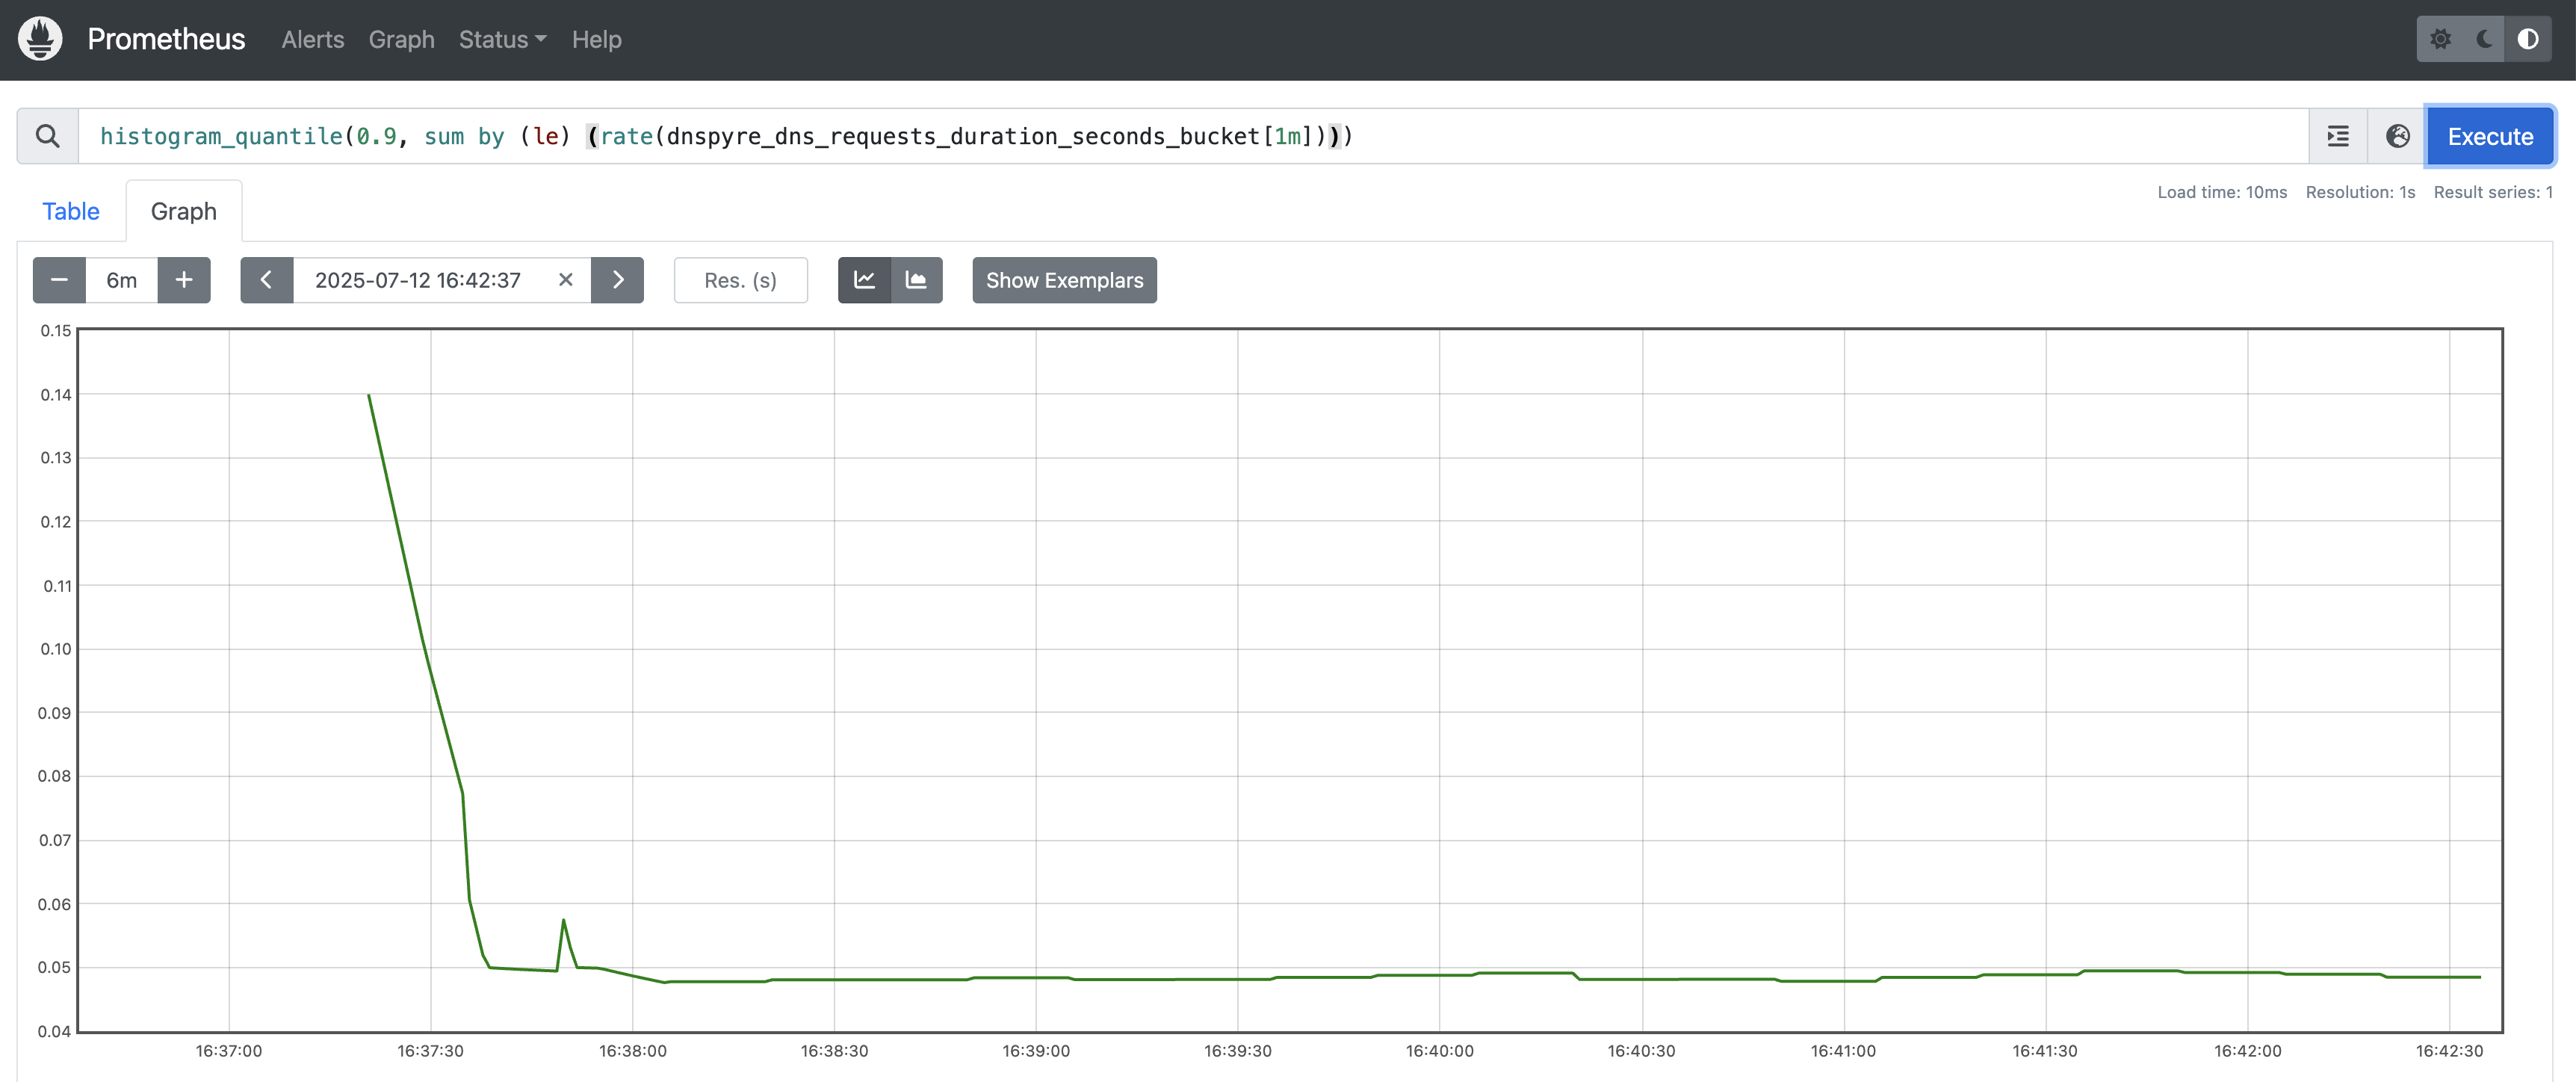
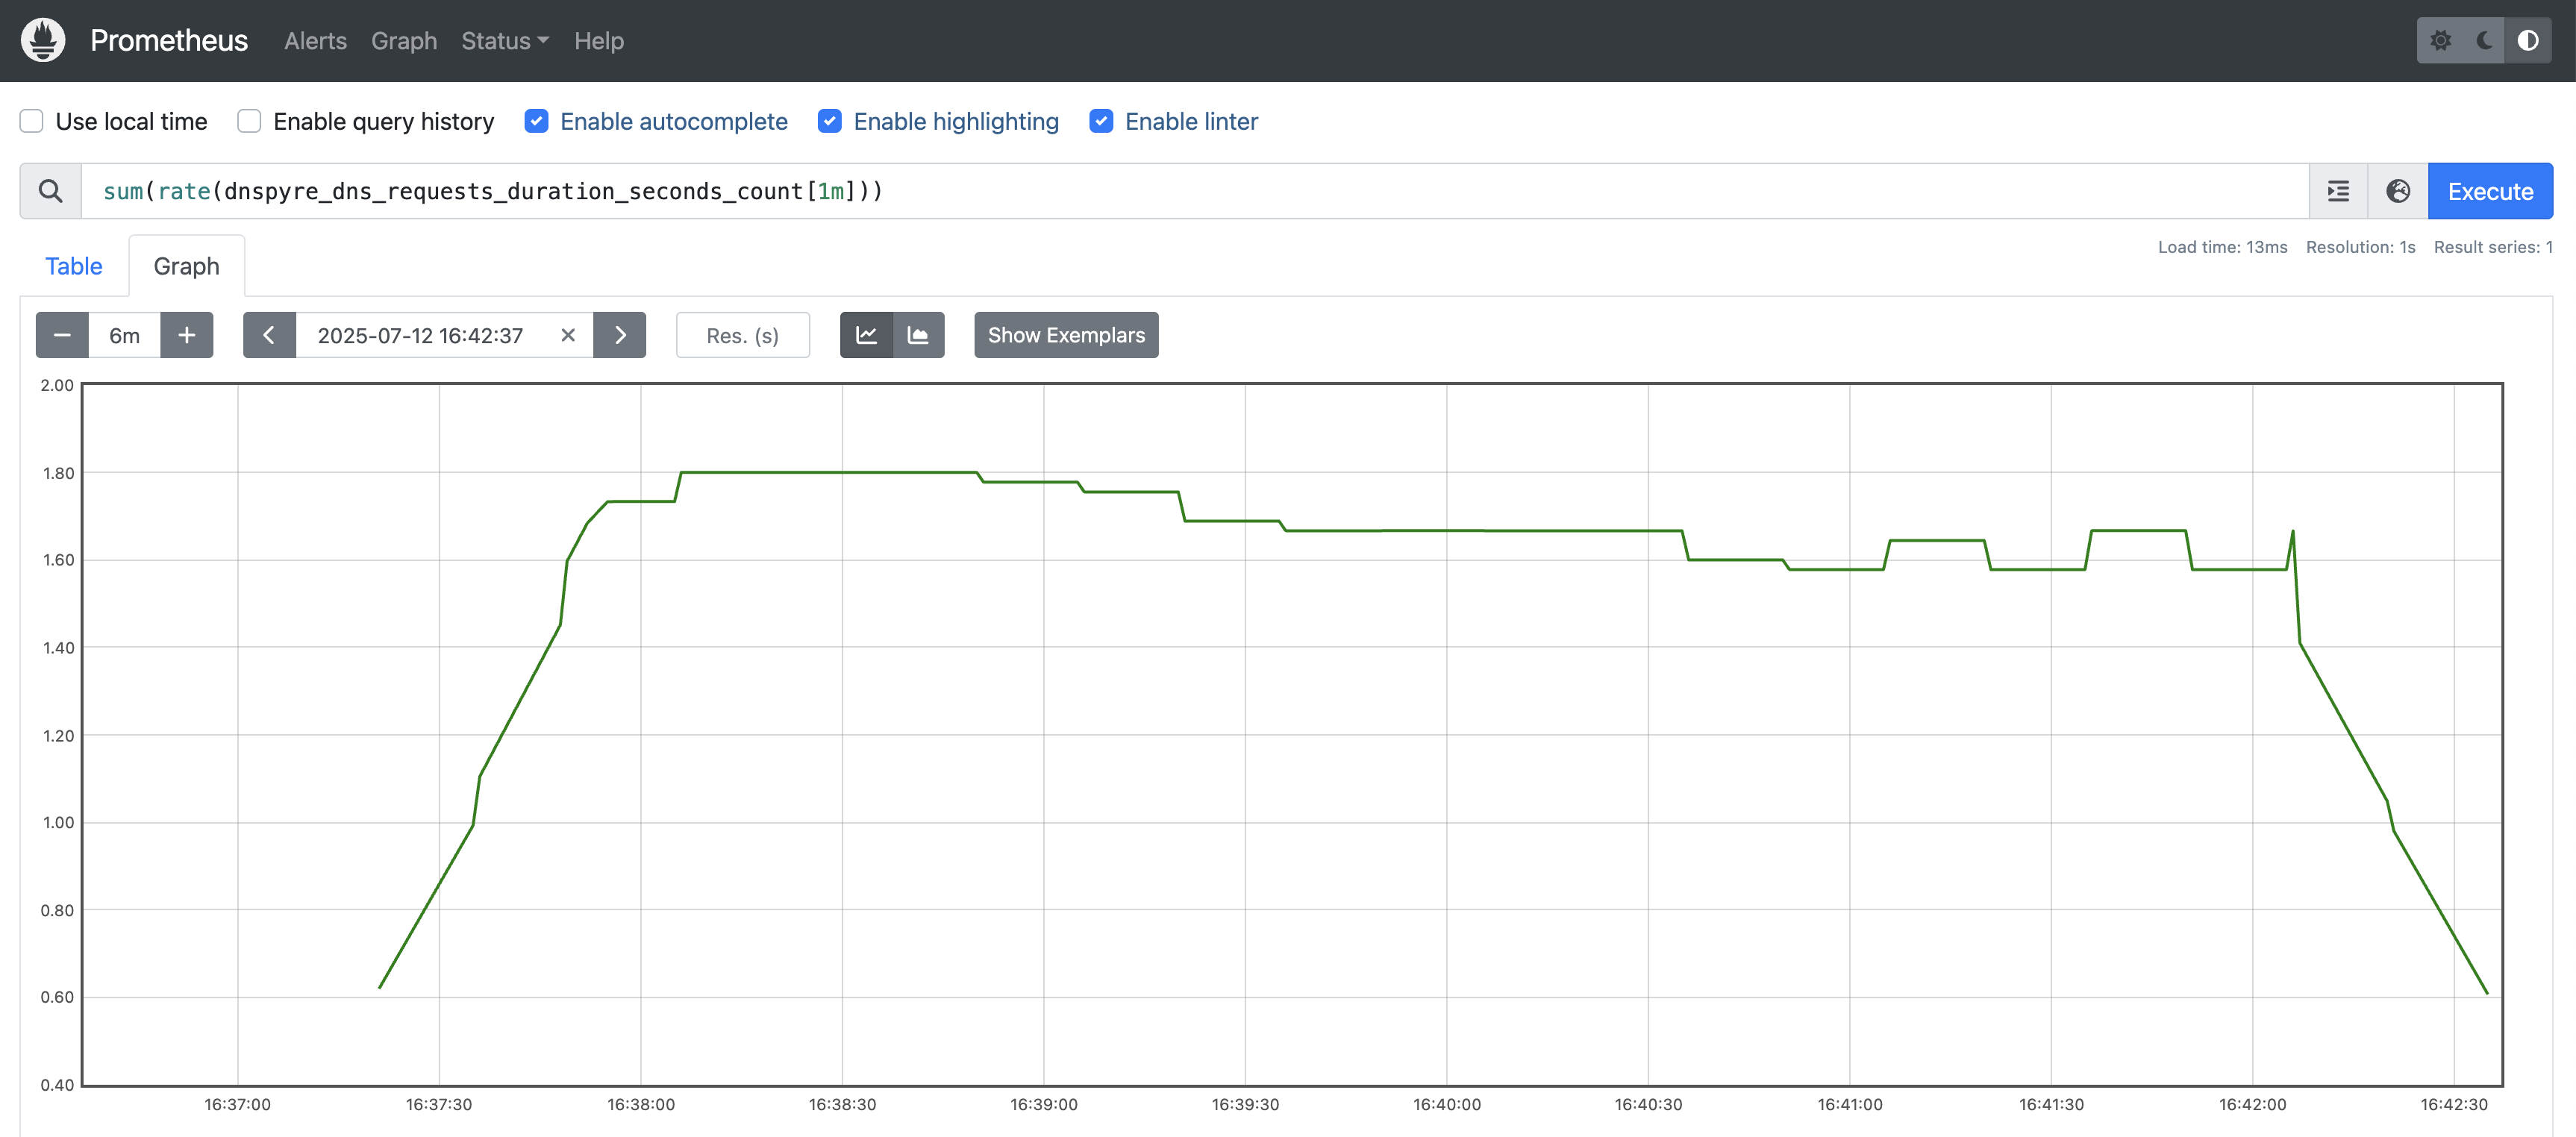
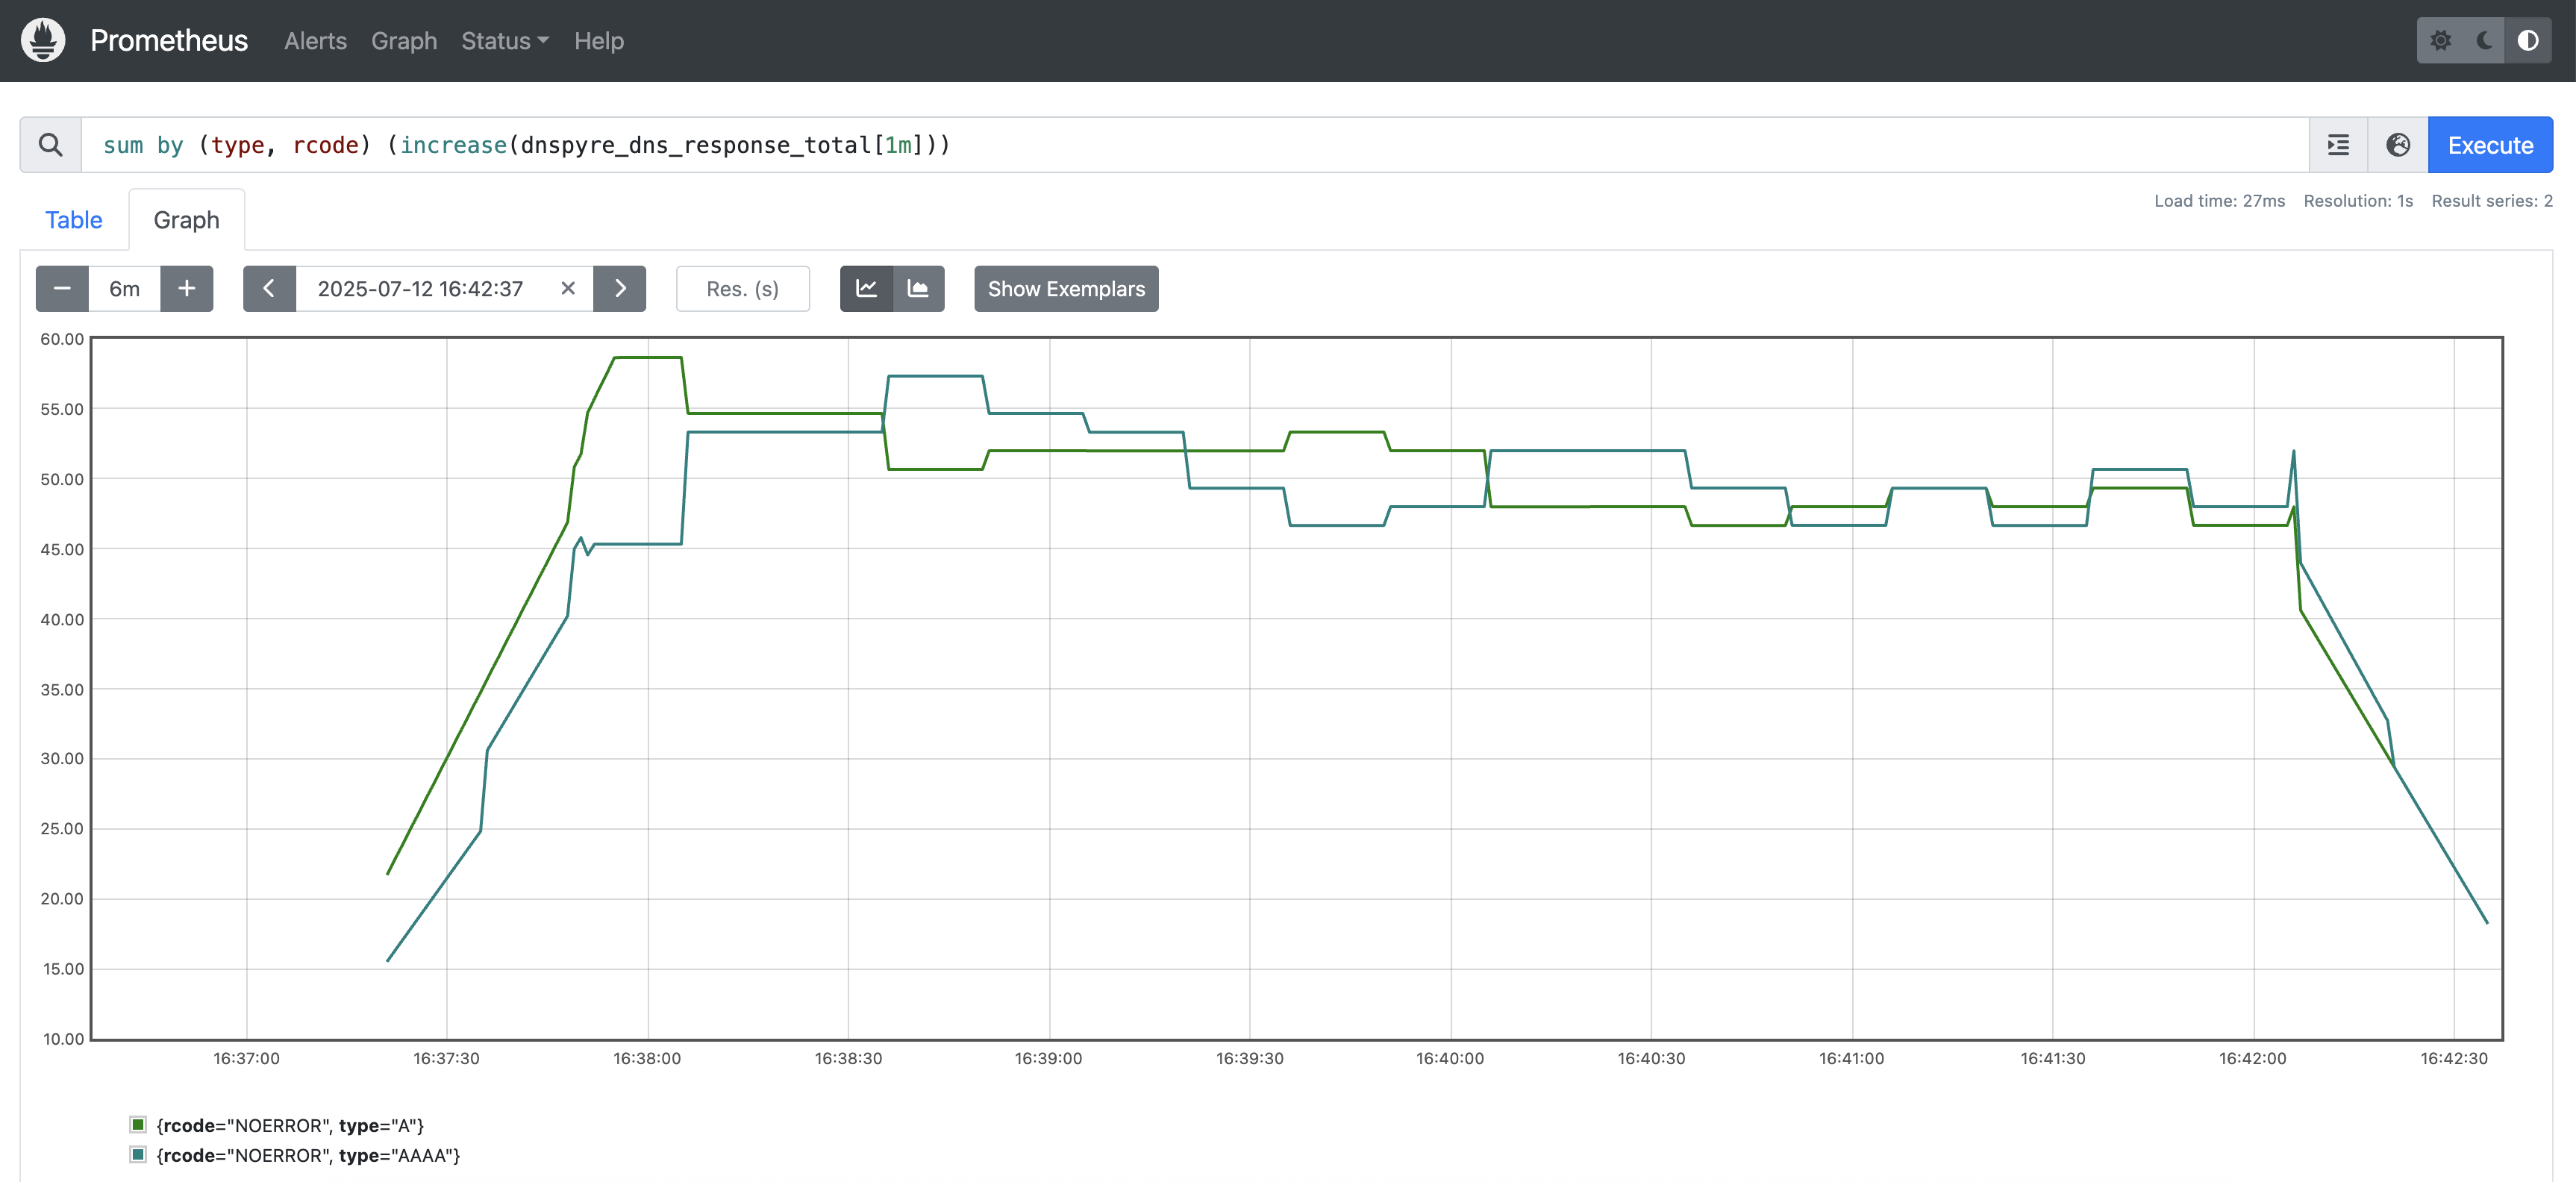
dnspyre_dns_requests_duration_seconds{type}= Histogram of DNS request durations by request typednspyre_dns_response_total{type,rcode}= Total number of DNS responses received by dnspyre by response type and rcodednspyre_errors_total= Total number of (I/O) errors while querying the DNS server
For example to expose Prometheus metrics on :8080/metrics you would specify --prometheus ':8080'
dnspyre --server 8.8.8.8 -c 10 -t A -t AAAA --duration 5m --request-delay 2s-10s --prometheus ':8080' google.com
The metrics can then be scraped and queried by Prometheus: